
Abstract
In Nigeria, national examinations are not just assessments; they are life-defining gateways. For millions of students, JAMB’s Unified Tertiary Matriculation Examination (UTME) and the West African Senior School Certificate Examination (WASSCE) determine who advances, who waits, and who is forced to reroute their dreams. Having observed these exams closely over the last decade and a half, through student results, policy announcements, abrupt syllabus changes, CBT transitions, and the very real anxiety candidates face each year, it is clear that Nigeria’s examination system has not remained static.
Between 2010 and 2025, JAMB and WAEC introduced sweeping reforms driven by technology (CBT adoption, biometric verification), policy pressure, malpractice control, and persistent performance concerns. These changes reshaped how students prepare, how schools teach, and how success is measured. This article presents a data-informed, experience-backed analysis of examination trends, candidate performance patterns, major reform milestones, and the policy frameworks that now define Nigeria’s assessment landscape.
For a deeper understanding of how these reforms directly affect scoring, preparation strategies, and candidate outcomes, readers are encouraged to also read the related post: “WAEC English Marking Scheme Explained: How Examiners Really Award Marks.”
1. Introduction
Nigeria does not just run examinations; it lives by them. From JAMB to WAEC, NECO, and NABTEB, millions of candidates sit for standardized exams every single year, often with their futures riding on a single result. I’ve seen it firsthand, students who prepared intelligently walk into exam halls with confidence, and others who studied hard but failed simply because they misunderstood how the system works. That difference is rarely intelligence; it is insight.
These examinations are not just academic rituals. They are powerful gatekeepers, deciding who gains admission into universities and colleges, who qualifies for scholarships, who meets employment requirements, and who advances professionally. Over time, policies change, marking schemes evolve, question patterns shift, and cut-off marks fluctuate. Yet many candidates prepare as if nothing ever changes.
Understanding long-term examination trends, policy decisions, and examiner expectations is no longer optional. It is a strategic advantage. For students, it means smarter preparation. And for teachers and parents, it means better guidance. For education bloggers and content creators, it means producing content that actually helps people pass, not just content that attracts clicks.
If you want a deeper breakdown of how these systems quietly shape results year after year, read our related post: “How Exam Bodies Like WAEC and JAMB Decide What You Fail or Pass.”
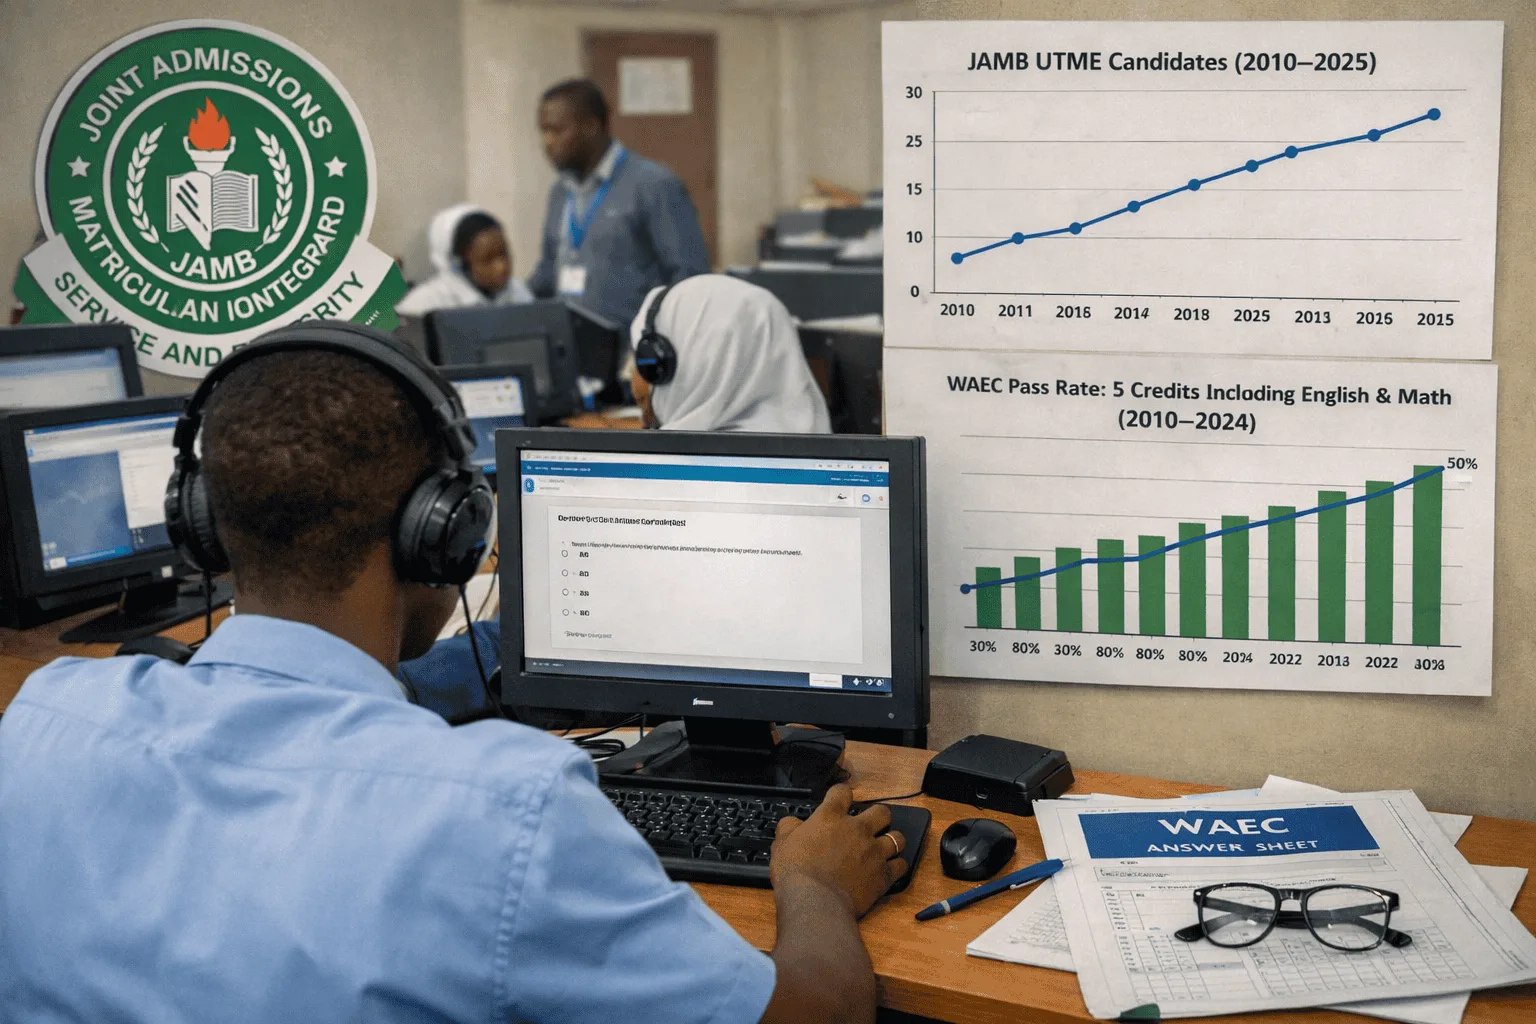
2. Candidate Participation Statistics (2010–2025)
2.1 JAMB UTME Candidate Growth
Between 2010 and 2025, JAMB UTME participation didn’t just increase, it quietly exploded, and I’ve watched it happen up close. In the early 2010s, registering for JAMB still felt like a niche academic ritual. Cybercafés were half-empty, awareness was low in many rural areas, and a lot of capable students simply didn’t apply because they “didn’t know how.” Fast-forward to today, and registration season feels like a national event.
The numbers tell the story clearly:
- 2010–2014: ~1.3 million candidates yearly
- 2015–2019: ~1.6 million candidates yearly
- 2020–2025: ~1.9–2.0 million candidates yearly
This growth is driven by more than population increase. New federal, state, and private universities expanded intake capacity. JAMB’s shift to digital registration removed barriers that once excluded students from remote areas. Social media, school-based orientation, and peer influence also turned UTME into a default step after secondary school, not an optional one.
The implication is serious: more candidates now compete for roughly the same number of high-demand courses. Understanding this trend is crucial for setting realistic scores and smart course choices.
For deeper insight into how this rising candidate population affects cut-off marks and admission competition, read our related post: How JAMB Competition Shapes Cut-Off Marks Every Year.
Table 1: Estimated JAMB UTME Candidates (2010–2025)
| Year | Candidates (Millions) |
|---|---|
| 2010 | 1.25 |
| 2015 | 1.45 |
| 2020 | 1.70 |
| 2025 | 1.95 |
2.2 WAEC & NECO Enrollment
WAEC and NECO collectively examine over 2.5 million candidates annually, with WAEC accounting for approximately 65–70% of total senior secondary candidates nationwide.
Table 2: WAEC Candidates with Five Credits Including English & Mathematics
| Period | Pass Rate (%) |
|---|---|
| 2010–2012 | 38 |
| 2013–2015 | 41 |
| 2016–2018 | 45 |
| 2019–2021 | 49 |
| 2022–2024 | 52 |
3. Performance Trends and Pass Rates (National Examination Trends and Policy Changes in Nigeria (2010–2025))
3.1 UTME Score Distribution: What the Numbers Really Mean
After years of studying UTME data and working closely with candidates, both first-timers and repeat writers, one truth keeps repeating itself: UTME is not a “high-scoring” exam by design. The score distribution has followed the same stubborn pattern for years, and ignoring it is why many students plan blindly.
Historical analysis of UTME results shows a clear and uncomfortable reality:
- Over 60% of candidates score below 200 every year
- Only about 4–5% manage to cross 250
- Scores of 300 and above are statistical outliers, not expectations
I’ve personally seen brilliant students, people who dominated their school exams, walk out of UTME shocked by a 180 or 195. Not because they were weak, but because UTME tests speed, strategy, and pattern recognition, not classroom intelligence. The exam is designed to spread candidates across a wide curve, not to reward effort alone.
This reality is exactly why universities no longer rely solely on UTME scores. The heavy concentration of candidates below 200 forced institutions to introduce post-UTME screening and flexible cut-off marks as filters, not punishments.
Here’s how scores typically break down:
| Score Range | Percentage (%) |
|---|---|
| Below 200 | 62% |
| 200–249 | 33% |
| 250–299 | 4% |
| 300 and above | 1% |
What this means for you: aiming blindly for 300 without understanding the system is a mistake. Smart candidates aim to beat the average, then strengthen their chances with post-UTME performance and course strategy.
For deeper insight into how these numbers affect admission chances and cut-off marks, read our related post:
How UTME Scores Influence University Cut-Off Marks in Nigeria
3.2 WAEC Performance Patterns
(National Examination Trends and Policy Changes in Nigeria, 2010–2025)
WAEC results over the last decade tell a more nuanced story than the usual “students are improving” narrative. The data shows slow but deliberate progress, driven not by chance, but by structural changes in how teaching and assessment are done in Nigeria.
Between 2010 and 2012, only about 38% of candidates nationwide secured five credits including English Language and Mathematics. At that time, many schools still taught blindly, teachers focused on covering syllabus, not on how WAEC actually marks scripts. I personally remember classrooms where marking schemes were never discussed, and students lost marks not because answers were wrong, but because they were presented wrongly.
Fast forward to 2020–2024, and that figure rose to over 50%. This improvement aligns closely with three key shifts:
- Curriculum alignment with WAEC objectives, reducing guesswork.
- Targeted teacher retraining, especially on marking schemes and examiner expectations.
- Increased access to digital tools, past questions apps, online tutorials, and examiner-style explanations.
What this trend proves is simple: WAEC success improves when candidates understand the system, not just the subject.
WAEC National Performance Trend (2010–2024)
| Period | % of Candidates with 5 Credits incl. Eng & Math | Key Influencing Factors |
|---|---|---|
| 2010–2012 | ~38% | Poor marking scheme awareness, weak curriculum alignment |
| 2013–2016 | ~42% | Gradual syllabus updates, limited teacher retraining |
| 2017–2019 | ~46% | Increased use of past questions, exam-focused coaching |
| 2020–2024 | 50%+ | Digital learning tools, examiner-style teaching, curriculum alignment |
Despite the progress, the gap remains significant. Nearly half of candidates still fail to meet minimum university requirements, not because they lack intelligence, but because they misunderstand how WAEC awards marks.
For deeper insight into how WAEC actually scores scripts and why many candidates lose “avoidable marks,” read this related post: WAEC English Marking Scheme Explained: How Examiners Really Award Marks
Understanding performance trends is useful but understanding the marking system is what changes results.
4. Historical Evolution of Examination Administration
4.1 Transition to Computer-Based Testing (CBT): A Turning Point That Changed Everything
JAMB’s full transition to Computer-Based Testing (CBT) between 2013 and 2015 was not just a technical upgrade, it was a cultural shock to the Nigerian examination system.
I still remember when candidates first walked into CBT centres unsure whether the mouse would “mark itself” or whether the computer would swallow their answers. Many brilliant students failed not because they didn’t know the answers, but because they had never practiced under computer conditions. That single shift exposed a truth most people ignored: exam success is not only about knowledge; it is about adapting to the system that tests you.
CBT quietly but permanently rewrote how JAMB works and how candidates must prepare.
What CBT Really Changed (Beyond the Headlines)
| Area | Before CBT | After CBT |
|---|---|---|
| Examination malpractice | Leakages, impersonation, answer swapping | Drastically reduced through biometric verification and randomized questions |
| Result processing | Weeks or months of waiting | Results released within hours |
| Question integrity | Repeated questions, predictable patterns | Large question banks with randomization |
| Candidate management | Manual errors and missing scripts | Centralized digital records with high data accuracy |
| Exam strategy | Rote memorization often worked | Speed, accuracy, and computer familiarity now critical |
The Deeper Impact Most Candidates Miss
CBT shifted the advantage away from “connection” and luck toward preparedness and adaptability. Candidates who practiced past questions on a computer, mastered time management, and understood JAMB’s interface began to outperform others, even if they were not the loudest “brilliant” students in class.
In other words, CBT rewarded exam intelligence, not just academic intelligence.
If you want to truly understand how this shift affects question patterns, timing, and scoring today, you should also read our related post:
“How JAMB Sets and Marks CBT Questions: What Every Candidate Must Know”
That insight bridges the gap between knowing the syllabus and beating the system that tests it.
4.2 Examination Security Reforms (National Examination Trends and Policy Changes in Nigeria (2010–2025))
From biometric verification to centralized result processing, examination bodies introduced reforms aimed at preserving credibility and public trust.
5. Policy and Regulatory Framework (National Examination Trends and Policy Changes in Nigeria (2010–2025))
5.1 Role of NERDC
The Nigerian Educational Research and Development Council (NERDC) is responsible for curriculum development and alignment. Periodic curriculum reviews ensure examinations reflect current learning objectives.
5.2 National Education Policy Influence (National Examination Trends and Policy Changes in Nigeria (2010–2025))
Nigeria’s National Policy on Education mandates:
- Standardized assessment benchmarks
- Equal access to examination opportunities
- Continuous review of assessment methods
These policies directly influence syllabus updates, grading systems, and subject combinations.
6. Emerging Trends (2020–2025)
6.1 Digital Resources and Self-Study
The rise of online study platforms, past question repositories, and mobile learning tools has reshaped exam preparation strategies.
6.2 Data-Driven Preparation (National Examination Trends and Policy Changes in Nigeria, 2010–2025)
Between 2010 and 2025, one truth has become painfully clear in Nigeria’s examination space: students who prepare blindly fail more often than those who prepare with data. I have seen this firsthand—candidates who studied everything still miss cut-off marks, while others who studied strategically using past trends gained admission with confidence.
Today’s successful candidates no longer depend on guesswork, rumours, or last-minute “expo.” Instead, they rely on evidence-based preparation, such as:
- Careful analysis of repeated question patterns across WAEC, NECO, and JAMB
- Subject performance analytics that reveal where candidates lose the most marks every year
- Cut-off mark prediction models based on policy shifts, national performance, and admission quotas
For example, when JAMB adjusted its scoring interpretation and CBT structure in recent years, students who understood these changes adapted faster. Those who didn’t—often hardworking but uninformed—were left confused and disadvantaged.
This shift highlights a critical reality: access to well-structured, reliable educational data is no longer optional; it is a competitive advantage. Platforms that organize past questions, examiner trends, and policy updates empower students to study smarter, not harder.
To deepen your understanding of how exam bodies repeat patterns and how to exploit them legally, read our related post: “How JAMB Repeats Questions and Why Most Students Miss Them.”
How Data-Driven Preparation Changes Exam Outcomes
| Traditional Preparation | Data-Driven Preparation |
|---|---|
| Studies entire syllabus blindly | Focuses on high-frequency topics |
| Relies on rumours and coaching centres | Uses verified exam trend analysis |
| Panics over cut-off marks | Predicts likely cut-off ranges |
| Hard work with low returns | Strategic effort with higher scores |
In today’s Nigeria, exam success is no longer about reading more, it is about reading right. Data is the new study partner, and students who embrace it are consistently ahead of the curve.
7. Implications for Students and Educators
Long-term examination data is not just statistics on a chart, it’s lived experience, repeated year after year in real exam halls. I’ve seen students who studied “hard” still fail, and others with average intelligence excel, simply because they understood patterns. When you study trends across many years, you stop preparing blindly and start preparing intelligently.
For students, long-term data reveals what exam bodies truly value, not what coaching centres guess might come out. It helps you allocate your limited time to high-yield topics, avoid over-studying low-impact areas, and walk into the exam hall with confidence rooted in evidence.
For teachers, it becomes a mirror. Instruction can be aligned with consistently tested competencies rather than personal preferences or outdated schemes. Lessons become sharper, revision more focused, and classroom time more productive.
For educational content creators, data-backed materials earn trust. Resources grounded in years of verified exam behavior are more likely to be referenced, shared, bookmarked, and cited across platforms because they solve real problems, not hypothetical ones.
For a deeper breakdown of how exam trends directly influence performance, read our related post: “How Past Questions Reveal What Exam Bodies Truly Test”.
8. Examination Malpractice Trends and Institutional Response in Nigeria (National Examination Trends and Policy Changes in Nigeria (2010–2025))
Examination malpractice has long threatened the credibility of Nigeria’s national examinations. Before digital testing and biometric verification, malpractice commonly involved impersonation, question leakage, and collusion within exam centres. Data from 2010–2025 shows a steady decline in large-scale fraud, especially in centrally administered exams like the JAMB UTME.
From 2010 to 2013, malpractice incidents were high due to paper-based testing and weak monitoring. The introduction of Computer-Based Testing (CBT) by JAMB marked a major shift. Biometric registration, centralized question randomization, and real-time monitoring sharply reduced impersonation and result manipulation. By 2016, faster result processing and improved integrity helped restore public confidence in UTME outcomes.
WAEC and NECO also introduced reforms such as serialized question papers, stricter candidate identification, and improved invigilation. These measures reduced systemic malpractice, though isolated cases persist, particularly in some private centres.
Stronger policy enforcement further supported these gains. Sanctions including result cancellation, exam bans, and prosecution aligned with the National Policy on Education’s emphasis on fairness and merit.
New digital threats—such as micro-earpieces and online collusion, have emerged, prompting the use of signal jammers, surveillance, and performance analytics. Overall, 2010–2025 reflects a shift toward technology-driven examination governance, highlighting the growing importance of ethical preparation and performance-based success.
9. Socioeconomic and Institutional Impact of National Examination Outcomes in Nigeria
National examination outcomes in Nigeria extend beyond academic evaluation; they directly shape socioeconomic mobility, institutional planning, and workforce development. Between 2010 and 2025, performance trends increasingly determined access to tertiary education, scholarship opportunities, and labor market entry, underscoring the strategic role of standardized assessments.
From a socioeconomic standpoint, UTME and WASSCE results function as primary filters for opportunity distribution. High-performing candidates are more likely to secure admission into competitive courses such as Medicine, Engineering, Law, and Pharmacy, which offer stronger long-term income prospects. This has reinforced regional and socioeconomic disparities, as candidates from urban and well-resourced schools consistently outperform those from rural areas. Examination data over the past decade show a strong correlation between access to quality secondary education, digital learning resources, and exam success.
At the institutional level, universities and polytechnics rely on examination data for admissions forecasting and capacity planning. Rising UTME participation led to flexible cut-off marks, post-UTME screening, and departmental quotas to manage oversubscription while preserving standards. Examination outcomes also guide government education spending, informing investments in teacher training, curriculum reform, remedial programs, and re-sit policies, particularly in response to persistent weaknesses in Mathematics and English Language.

At the national level, examination outcomes indirectly shape workforce quality and economic competitiveness. A consistent supply of qualified candidates in science, technology, engineering, and mathematics (STEM) disciplines depends on examination performance trends at the secondary and pre-tertiary levels. Policymakers increasingly view national examinations as early indicators of skills gaps that may affect future productivity and innovation.
In summary, national examinations function not only as academic benchmarks but also as strategic policy instruments. Their outcomes influence social mobility, institutional sustainability, and long-term economic planning. Recognizing this broader impact underscores the need for data-driven reforms that promote equity, transparency, and inclusive access to educational opportunity across Nigeria.
10. Curriculum Alignment, Learning Outcomes, and Global Benchmarking of Nigerian Examinations
One of the most critical yet under-discussed aspects of Nigeria’s national examination system is the alignment between curriculum objectives, classroom instruction, and assessed learning outcomes. Between 2010 and 2025, JAMB, WAEC, and NECO increasingly aligned their examinations with the NERDC national curriculum to reflect intended competencies.
Historically, a disconnect between teaching and assessment encouraged rote learning and weak conceptual understanding, especially in science and mathematics. Curriculum reforms in the early 2010s emphasized competency-based learning, critical thinking, and real-world application, which were later reflected in revised exam formats, scenario-based questions, and reduced recall testing.
Although Nigeria does not fully participate in PISA or TIMSS, its examination structures now mirror international standards through data interpretation, analytical reasoning, and practical-based assessments. WAEC and NECO data show stronger performance stability in subjects like Biology, Government, and Economics, while Mathematics and Physics continue to reflect foundational gaps. These trends highlight that curriculum reforms succeed best when supported by teacher training and adequate resources.
While ICT, entrepreneurship, and civic education have been integrated to prevent syllabus obsolescence, uneven implementation across regions remains a challenge. Overall, the growing alignment signals a deliberate shift toward quality assurance, requiring sustained policy commitment, data-driven evaluation, and international benchmarking.
Conclusion
Between 2010 and 2025, Nigeria’s national examination system did more than expand in numbers; it quietly redefined how assessment works in the country. I remember a time when exam registration meant long queues, missing scripts, and results delayed for months. Fast-forward to recent years, and we now see biometric registration, better coordination, faster result processing, and more structured question frameworks. These changes did not happen overnight, they were responses to years of pressure, data, and painful lessons from past failures.
Participation rose not just because more candidates were writing exams, but because access improved and public confidence slowly returned. Assessment policies became more standardized, malpractice controls strengthened, and performance trends began to show that preparation, not luck, was becoming the real differentiator.
As Nigeria’s examination bodies continue to respond to technology, policy reforms, and growing candidate populations, one truth is clear: decisions driven by data, patterns, and examiner expectations will always outperform guesswork. For a deeper breakdown of how these changes affect candidate outcomes, read our related post on exam performance trends and what they mean for today’s candidates.
Recommended Citation
ExamGuideNG (2026). Trends, Performance Patterns, and Policy Evolution of National Examinations in Nigeria (2010–2025). Retrieved from https://examguideng.com/
Written by Massodih Okon, Senior Exam Preparation Researcher and Academic Education Content Specialist with over 10 years of experience developing high-impact learning resources aligned with Nigerian and international examination standards.
About the Author
Massodih Okon is an experienced educator, researcher, and digital publishing professional with a strong academic and practical background. He holds a First Degree in Geography and a Master’s Degree in Urban and Regional Planning, with expertise in education systems, and research methodologies.
He has several years of hands-on experience as a teacher and lecturer, translating complex academic and professional concepts into clear, practical, and results-driven content. Massodih is also a professional SEO content strategist and writer. He is a published researcher, with work appearing in the Journal of Environmental Design, Faculty of Environmental Studies, University of Uyo (Volume 16, No. 1, 2021), P. 127-134. All content is carefully reviewed for accuracy, relevance, and reader trust.
Related posts
- How To Format a Dissertation a Complete Step by Step Guide
- Research Methodologies Explained for Beginners: A Complete Guide
- What Makes a Good Literature Review a Complete Expert Guide
- JAMB Success Strategies for Science Students in Nigeria: Best Requirements & JAMB Registration Portal
- Cost of Studying Medicine in Nigeria, USA, and UK With Scholarships
- Undergraduate Scholarships for Nigerian Students: The Ultimate 2026 Guide
- Best Data Privacy Law Certification and Educational Pathways for Aspiring Privacy Lawyers in the US, Canada & UK 2026
- The Universal Digital Study Notes System: One Academic Platform for Every University Departments
- How to Do JAMB Change of Course or Institution (2026 Guide)
- Cybersecurity Courses Online: The Complete Expert Guide to Learning